Tim FreemanAugust 03, 2020
Tag: Shear Cell Testing , Powder Flow , Tim Freeman , Freeman Technology
Shear Cell testing was originally designed to determine the incipient flow of continuous, cohesive powders under applied stress in order to simulate flow from a hopper/silo. When testing powders of this type to understand hopper behaviour, Shear Cell testing is a robust and complementary technique to the other methodologies employed by the FT4.
However, as a result of the mathematical models applied, analysis techniques used to derive commonly reported parameters are subject to limitations that can make the resulting data unreliable. Mohr’s circle analysis can introduce significant variation in the evaluation of Shear Cell test results, even when the directly measured values show an acceptable level of repeatability.

Types of Parameters
Shear Cell testing returns two different types of parameter. Firstly, there are parameters directly measured by the test:
· Shear Stress (τ) as a function of Normal Stress (σ)
· Pre-shear stress at steady-state
These values are measured in all Shear Cell tests, and are not typically subject to any form of approximation. The Shear Stress is then plotted as a function of the applied Normal Stress, and the data points used to construct a Yield Locus. The position of this Yield Locus is a reliable, repeatable expression of the stress required for the powder to shear against itself.
Secondly, there are parameters derived using Mohr’s circle analysis. These include (but are not limited to):
· Cohesion, from the point that the best-fit line modelling the Yield Locus intercepts the y-axis.
· Unconfined Yield Strength (UYS), from the greater of the two points where small Mohr’s circle intercepts the x-axis.
· Major Principle Stress (MPS), from the greater of the two points where the large Mohr’s circle intercepts the x-axis.
· Flow Function (FF), from the ratio of MPS to UYS.
· Angle of Internal Friction (AIF), from the angle between the Yield Locus and the horizontal.
Examples of the Limitations of Using Derived Parameters
The derived parameters depend on a mathematical model of the measured data, and are reliant on the assumption that the relationship between Shear Stress and Normal Stress is linear. However, this assumption is not always a true representation of the powder’s flow properties. A powder that is very sensitive to applied stress can generate a steep Yield Locus, leading to a linear best fit line which intercepts the y-axis very close to zero, generating a very low value for Cohesion. The associated small Mohr’s circle will therefore be very small, generating a very low UYS and consequently a very high FF. This can be misleading, as it suggests that the powder is very free-flowing, when in fact it exhibits considerable shear strength at high consolidation loads. Furthermore, a very minor variation in the attitude of the best fit line for each repeat of the test will cause a relatively large change in the y-intercept, and therefore the size of the small Mohr’s circle, and the resulting Cohesion, UYS and FF values.
Figure 1 shows an example of this issue using repeat tests of a commercial zeolite powder. The variation in the measured Shear Stress values between the two repeats is very small (less than 3% RSD), but due to the y-intercepts of the best-fit lines being so close to the origin, the very small difference in the position of the line results in a variation greater than 100% in the UYS, and more than 150% in the FF. This is again a consequence of the model applied to the data rather than a true reflection of the nature of the powder.
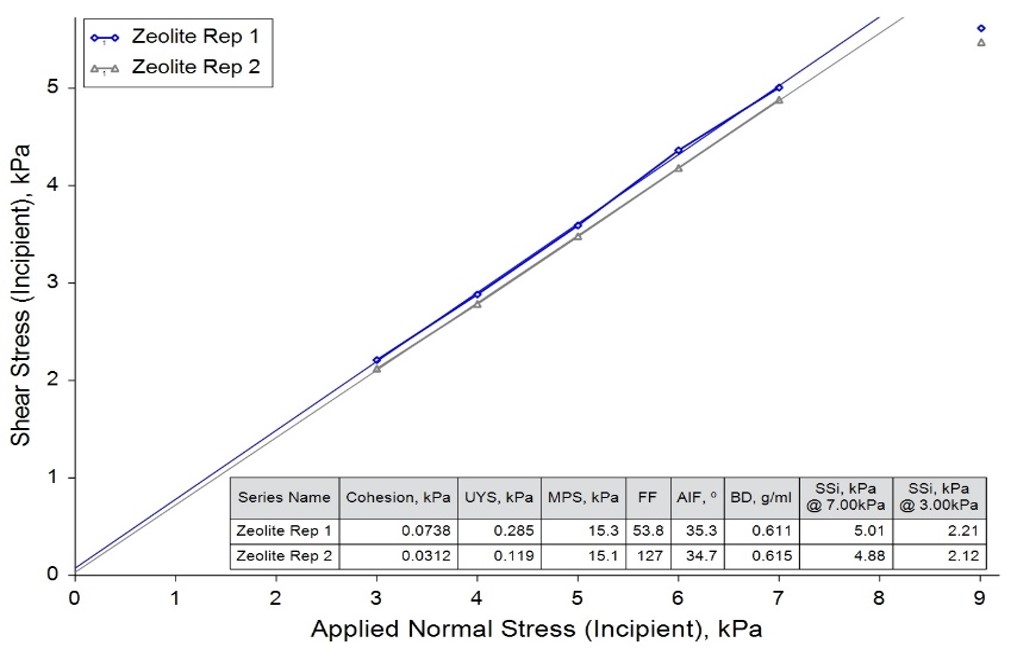
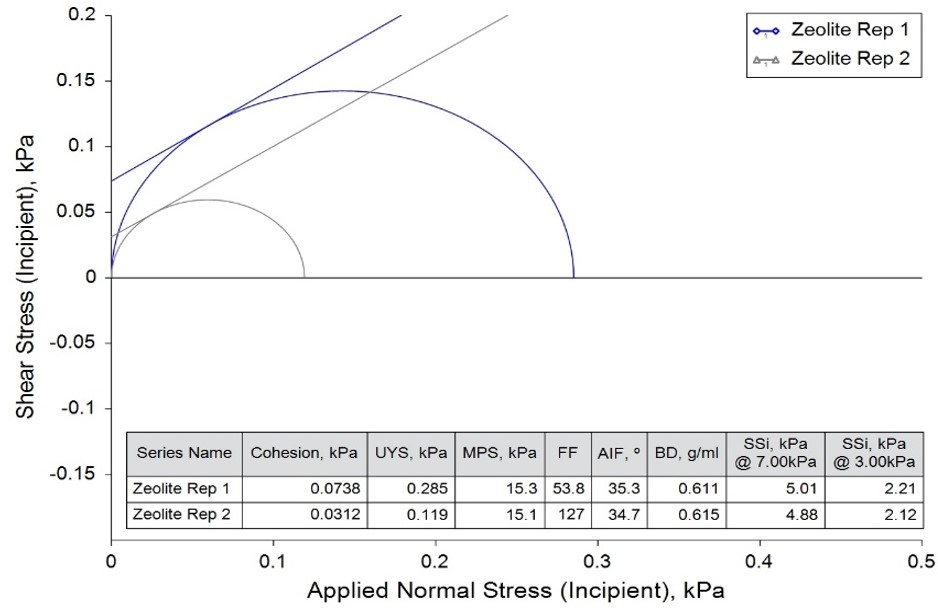
Figure 1: The effect that a y-intercept close to zero can have on derived Cohesion, UYS and FF values, despite small RSD in measured Shear Stress values (main graph on left, detail with variable small Mohr’s circles on right).
There are also circumstances where the Yield Locus is steep enough for the best-fit line to intercept the y-axis below zero, suggesting a negative value for Cohesion (another indication that the mathematical model does not necessarily represent the true nature of the powder). At this point, it is impossible to construct the small Mohr’s circle, and therefore impossible to obtain UYS and FF values. Similarly, when the best fit line is excessively shallow, the pre-Shear point can lie above the line rather than below it (see Figure 2). At this point, it is impossible to construct the large Mohr’s circle, and impossible to obtain MPS and FF values.
Figure 2 shows examples of these two phenomena. In the first, the best fit line from a third repeat on the commercial zeolite powder extends below the origin before intercepting the y-axis, returning no result for UYS and FF. In the second, the best-fit line applied to a test on a pharmaceutical excipient passes underneath the pre-shear point, returning no value for the MPS or FF.
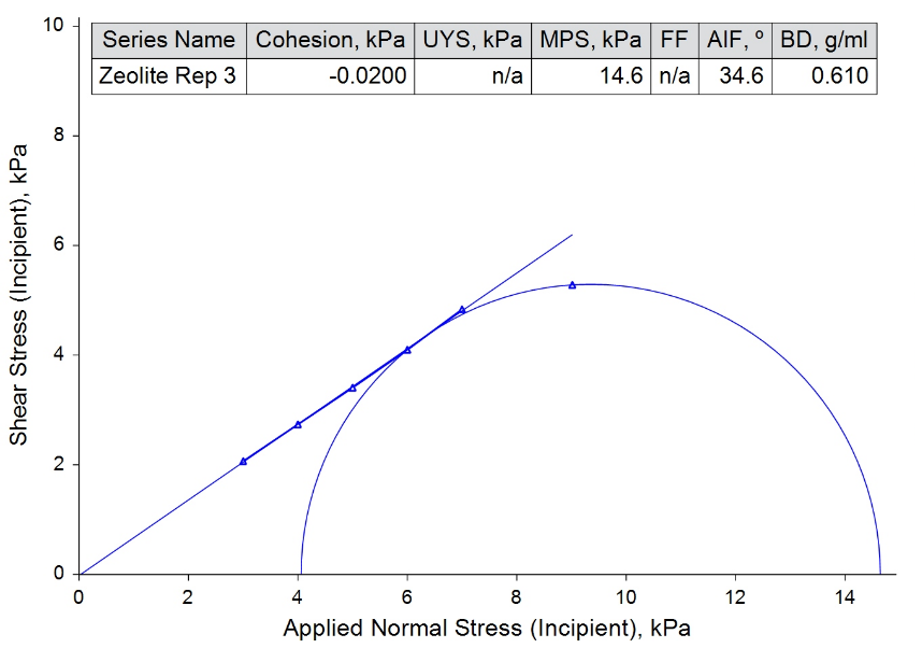
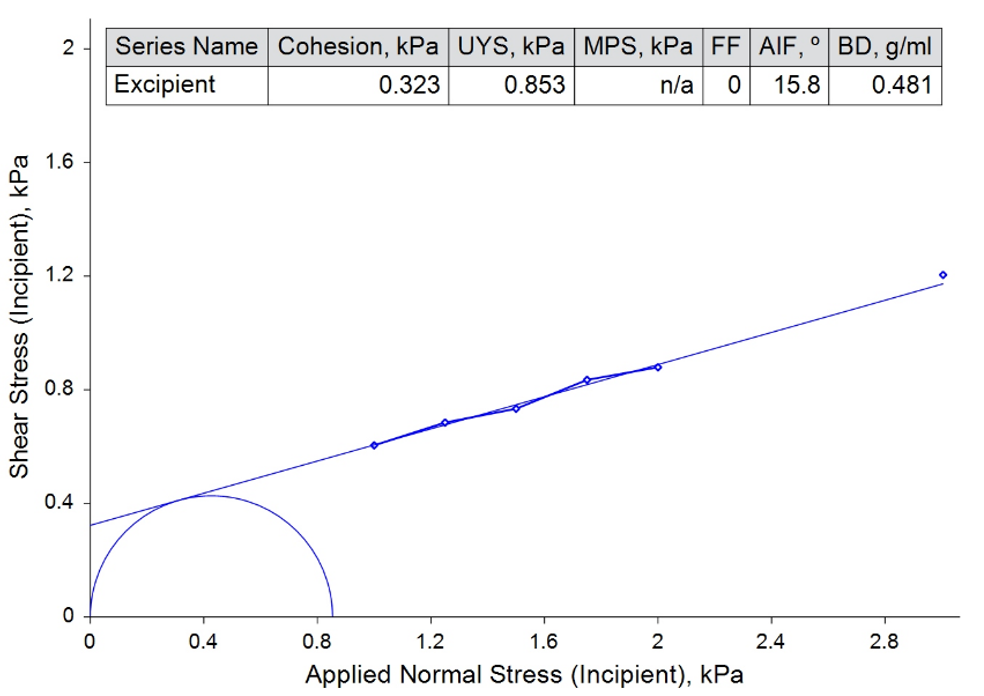
Figure 2: Best fit lines below the origin (impossible to obtain UYS) and below the pre-shear point (impossible to obtain MPS).
In practice, there is rarely, if ever, a truly linear relationship between Shear and Normal Stress: Shear values often deviate from a linear relationship as Normal Stress values approach zero, leading to a non-linear Yield Locus. This means that the derived value for Cohesion, and therefore UYS, are dependent on the technique being applied rather than the true properties of the powder.
Figure 3 shows an example of this variability on a sample of Sorbitol. The true Yield Locus is non-linear, but the linear best fit line does not take this into account when performing Mohr’s circle analysis and calculating the derived parameters, leading to a y-axis intercept below zero. Applying a curved best fit line and performing Mohr’s circle analysis again results in more realistic derived parameters in some cases, but with significant differences to those of the linear fit. This further demonstrates the influence of the mathematical model being applied.
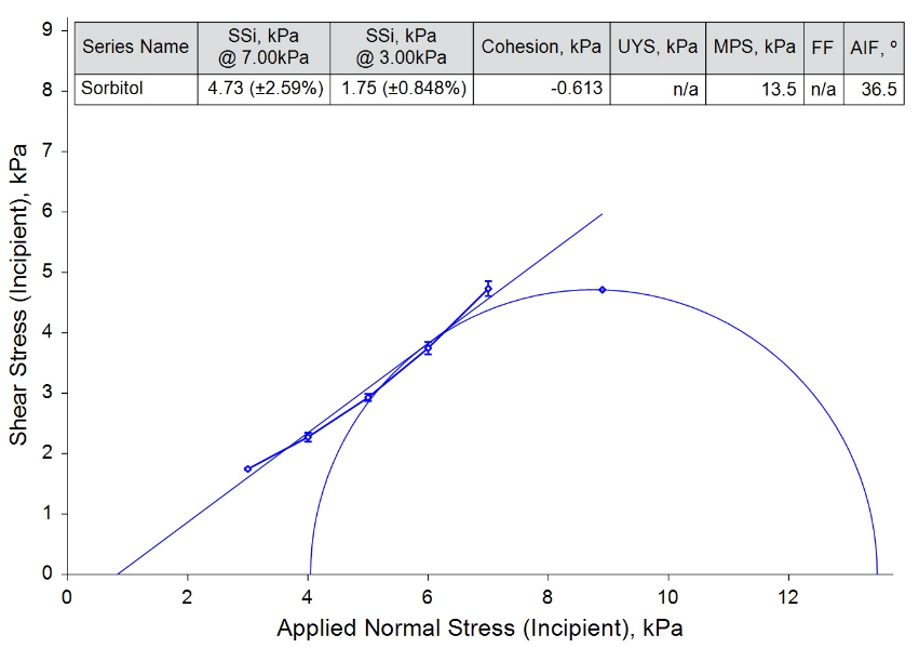
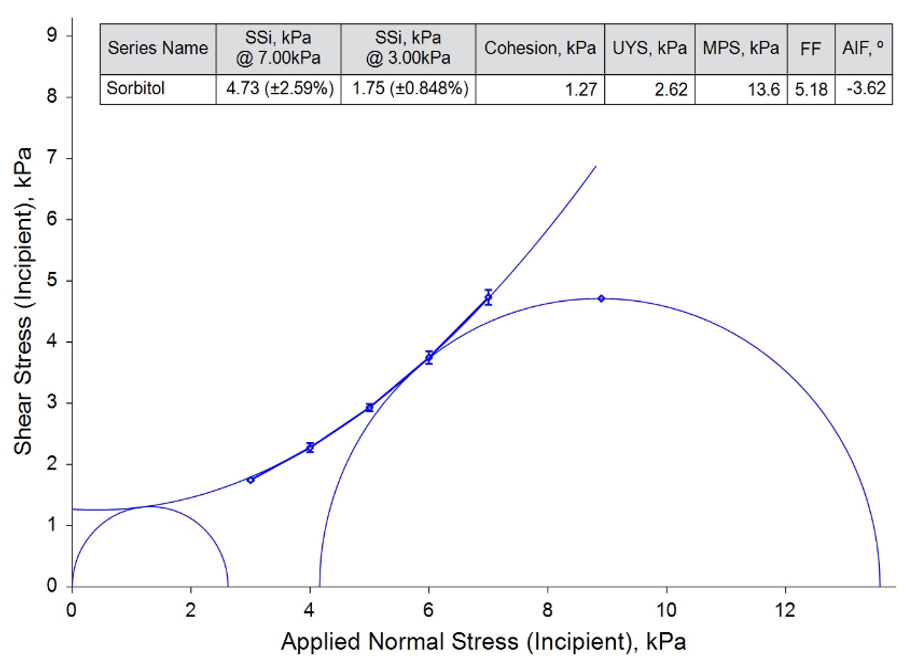
Figure 3: The difference between a linear best-fit line (left) and a better fitting curved yield locus (right) for the same test data.
Getting the Best from the Shear Cell Test
If the derived parameters are all that are recorded from Shear Cell tests, the situations described above will return no result for that test, preventing the comparison of that sample with others. Therefore, it is recommended that in addition to the derived parameters, measured Shear Stress values at maximum and minimum Normal Stress are also recorded. These will always be measurable, are not subject to any form of mathematical approximation, and will mean that Shear Cell test results can always be compared.
Related News:
Powder Flow: Optimising Unit Operations using the FT4 Powder Rheometer®
WEBINAR: POWDER FLOW ENHANCEMENT IN BATCH AND CONTINUOUS PROCESSES
Author Biography

Tim Freeman, Managing Director, Freeman Technology
Tim Freeman is Managing Director of powder characterisation company Freeman Technology for whom he has worked since the late 1990s. He was instrumental in the design and continuing development of the FT4 Powder Rheometer® and the Uniaxial Powder Tester. Through his work with various professional bodies, and involvement in industry initiatives, Tim is an established contributor to wider developments in powder processing.
Tim has a degree in Mechatronics from the University of Sussex in the UK. He is a mentor on a number of project groups for the Engineering Research Center for Structured Organic Particulate Systems in the US and a frequent contributor to industry conferences in the area of powder characterisation and processing. A past Chair of the American Association of Pharmaceutical Scientists (AAPS) Process Analytical Technology Focus Group Tim is a member of the Editorial Advisory Board of Pharmaceutical Technology and features on the Industry Expert Panel in European Pharmaceutical Review magazine. Tim is also a committee member of the Particle Technology Special Interest Group at the Institute of Chemical Engineers, Vice-Chair of the D18.24 sub-committee on the Characterisation and Handling of Powders and Bulk Solids at ASTM and a member of the United States Pharmacopeial (USP) General Chapters Physical Analysis Expert Committee (GC-PA EC).


Contact Us
Tel: (+86) 400 610 1188
WhatsApp/Telegram/Wechat: +86 13621645194
+86 15021993094
Follow Us:


 Pharma Sources Insight July 2025


